Thoughts & Data
Here I will write small-form explorations of recently published data, research, and news.
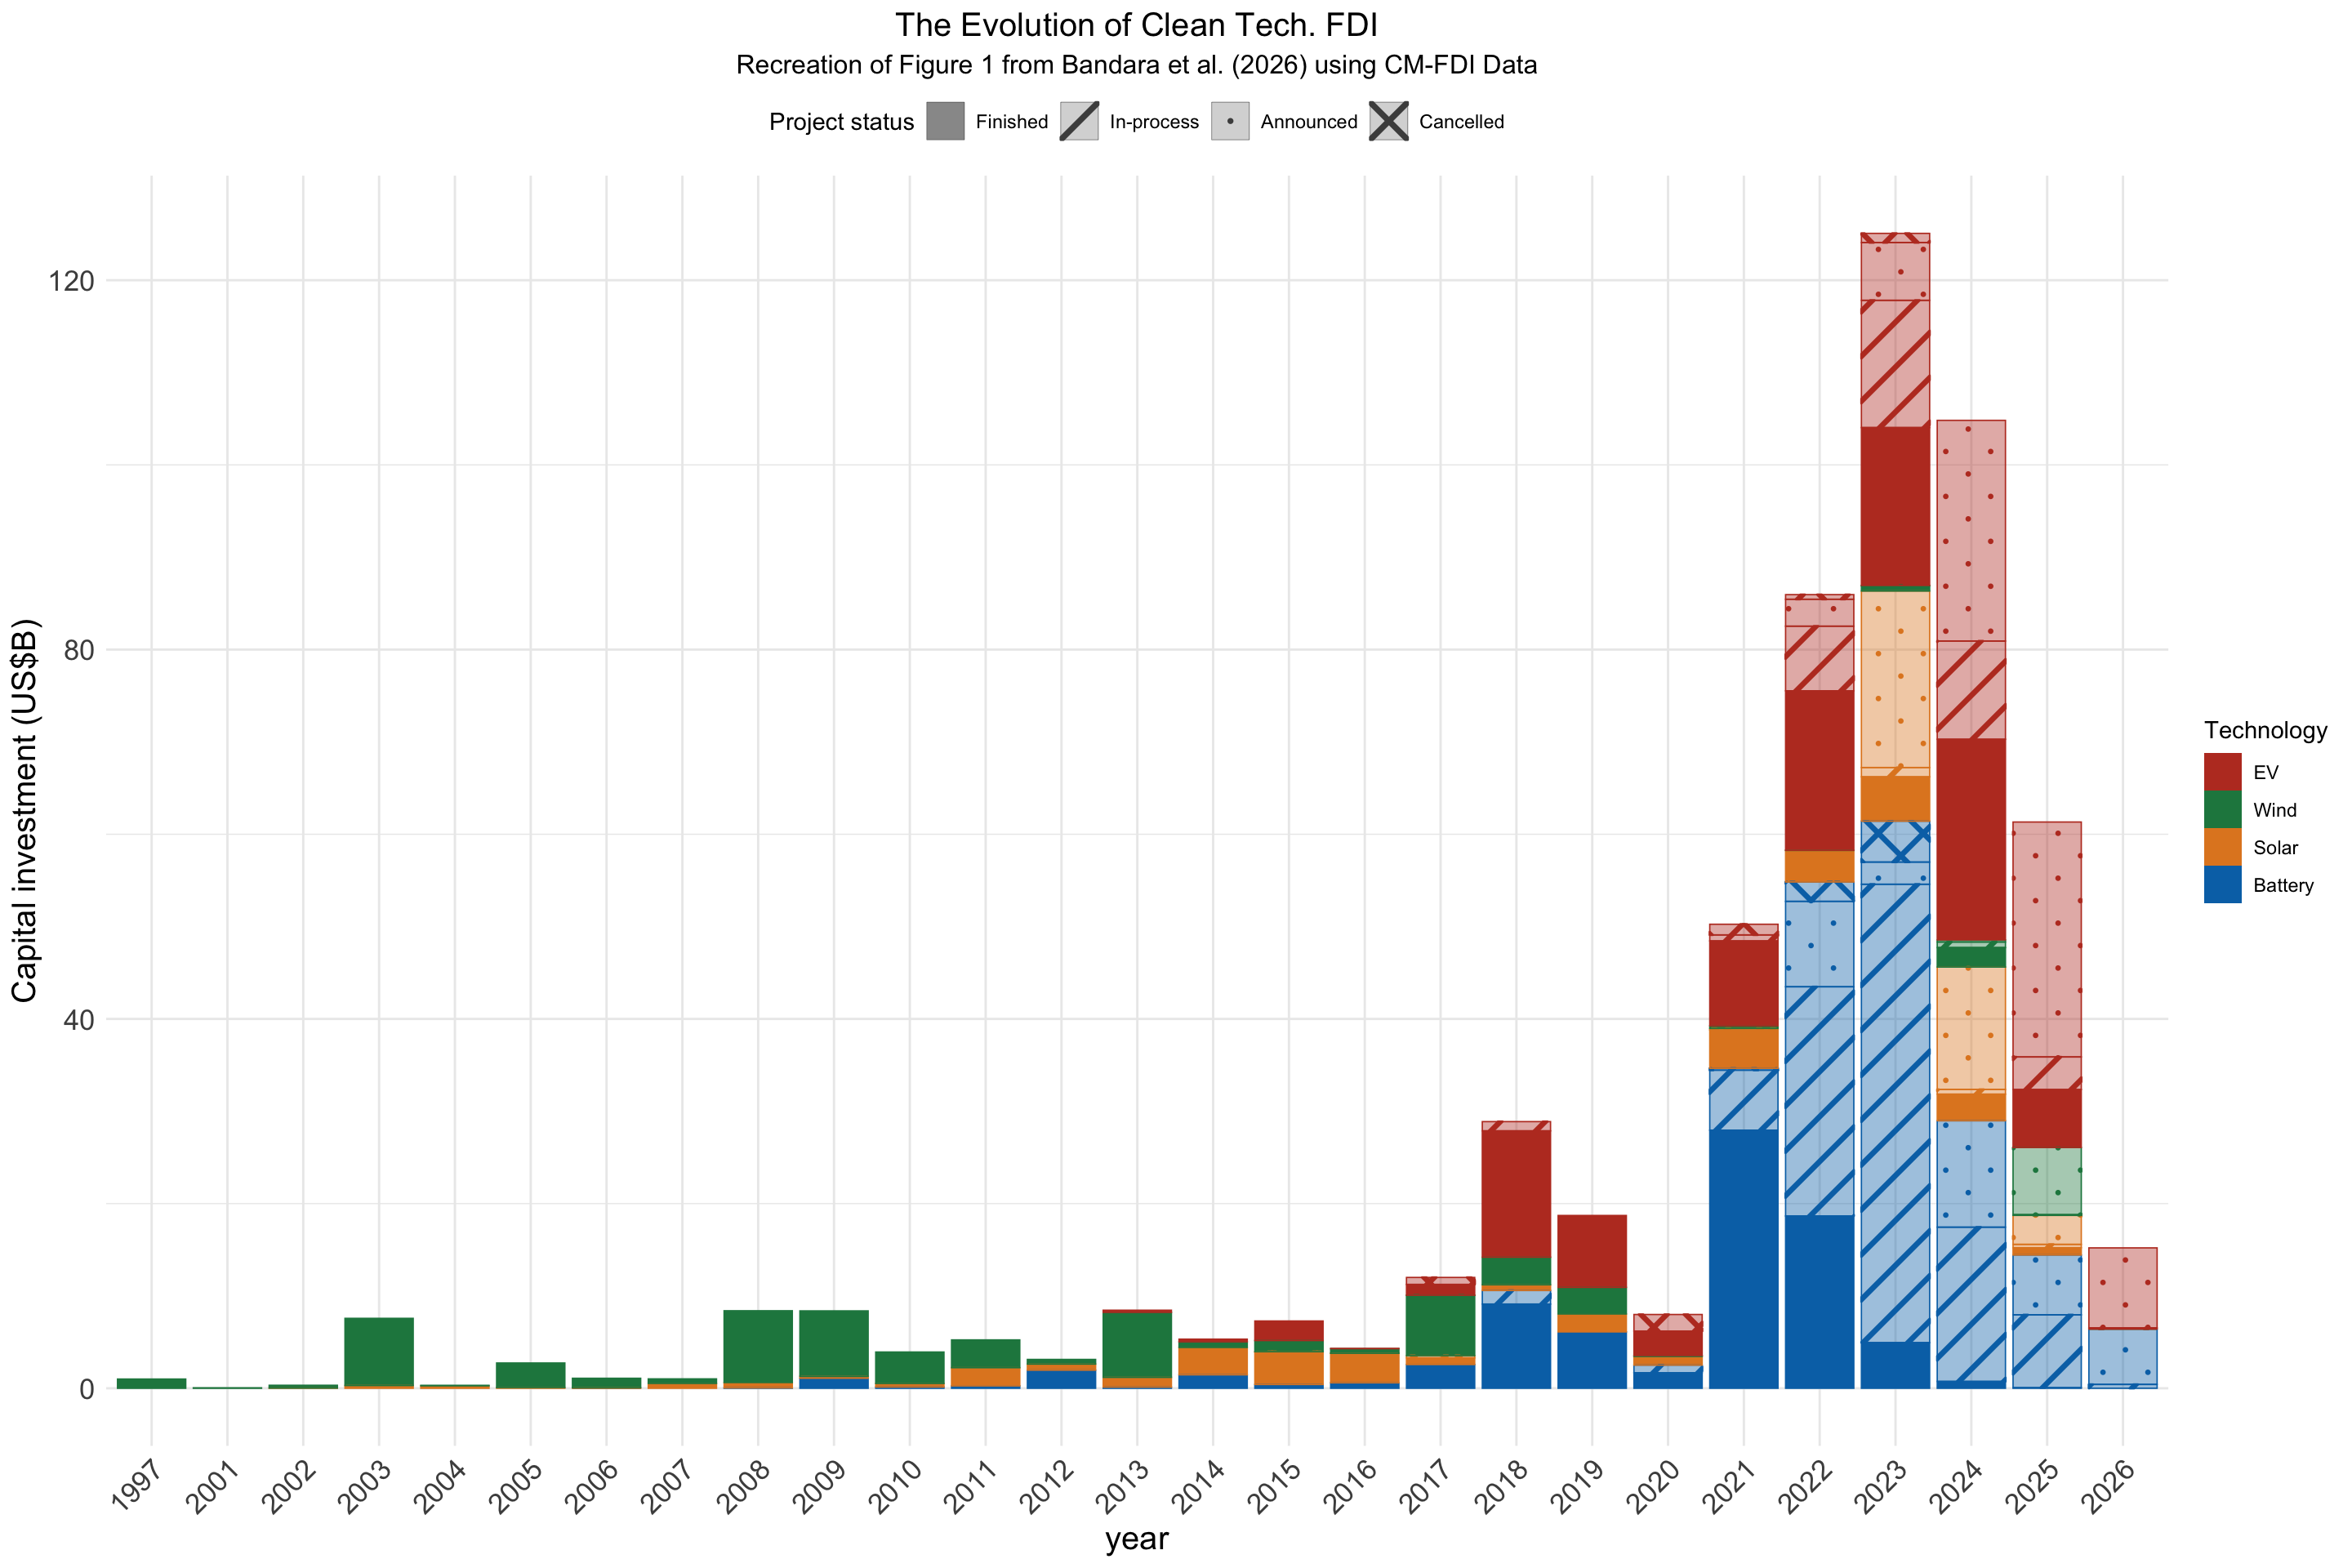
The Net Zero Industrial Policy Lab recently released their cleantech manufacturing foreign direct investment database, which provides a first look at global trends in clean technology investment, broken down by investing firm and country, destination city, broad sector/technology, and project status. The data covers investment flows between 2000 and 2025 (though the earliest project announcement occurs in 1997). Sector/technology (which are essentially the same thing, at least, for now) are broken into four clean technologies: wind, battery, EVs, and solar, while project status has seven classifications: announced, commenced, under construction, complete, operational, paused, cancelled, and closed. Status can helpfully be reduced to four classes, however, which are announced, in-process, cancelled, and finished. This is the same scheme used in Bandara et al. (2026) which introduces the data and analyzes push and pull factors driving the flow of clean tech manufacturing FDI across borders. If we take the raw data and reclassify project status along the lines of the authors, we can recreate Figure 1 from their paper, which provides insight into the evolution of CM-FDI over time.
The plot above (and the original Figure 1) plots CM-FDI according to the technology and the year in which the project was announced along with the status of the project at the time of the data’s publication. I think one of the most important contributions of this plot is we get an idea of sector or technologies that have grown more important over time. While CM-FDI was concentrated in renewable energy projects (with most of that investment flowing between advanced economies), since 2018 or so, investment has shifted into battery and EV manufacturing, which drove realized investment to a high point in 2023. The Inflation Reduction Act in 2022 and China’s Made in China 2025 both contributed to this high water mark and retrenchment followed with the election of Donald Trump in 2025. The 10 countries that are the largest sources of investment are listed below, along with their total amount invested (in billions of USD) and their accumulated share of total (realized) investments.
| Source Country | Amount (US$ Bn.) | Share |
|---|---|---|
| China | 135 | 0.32 |
| South Korea | 85 | 0.20 |
| Germany | 58 | 0.14 |
| Japan | 45 | 0.11 |
| United States | 22 | 0.05 |
| Netherlands | 21 | 0.05 |
| Denmark | 14 | 0.03 |
| India | 10 | 0.02 |
| France | 7 | 0.02 |
| Taiwan | 7 | 0.02 |
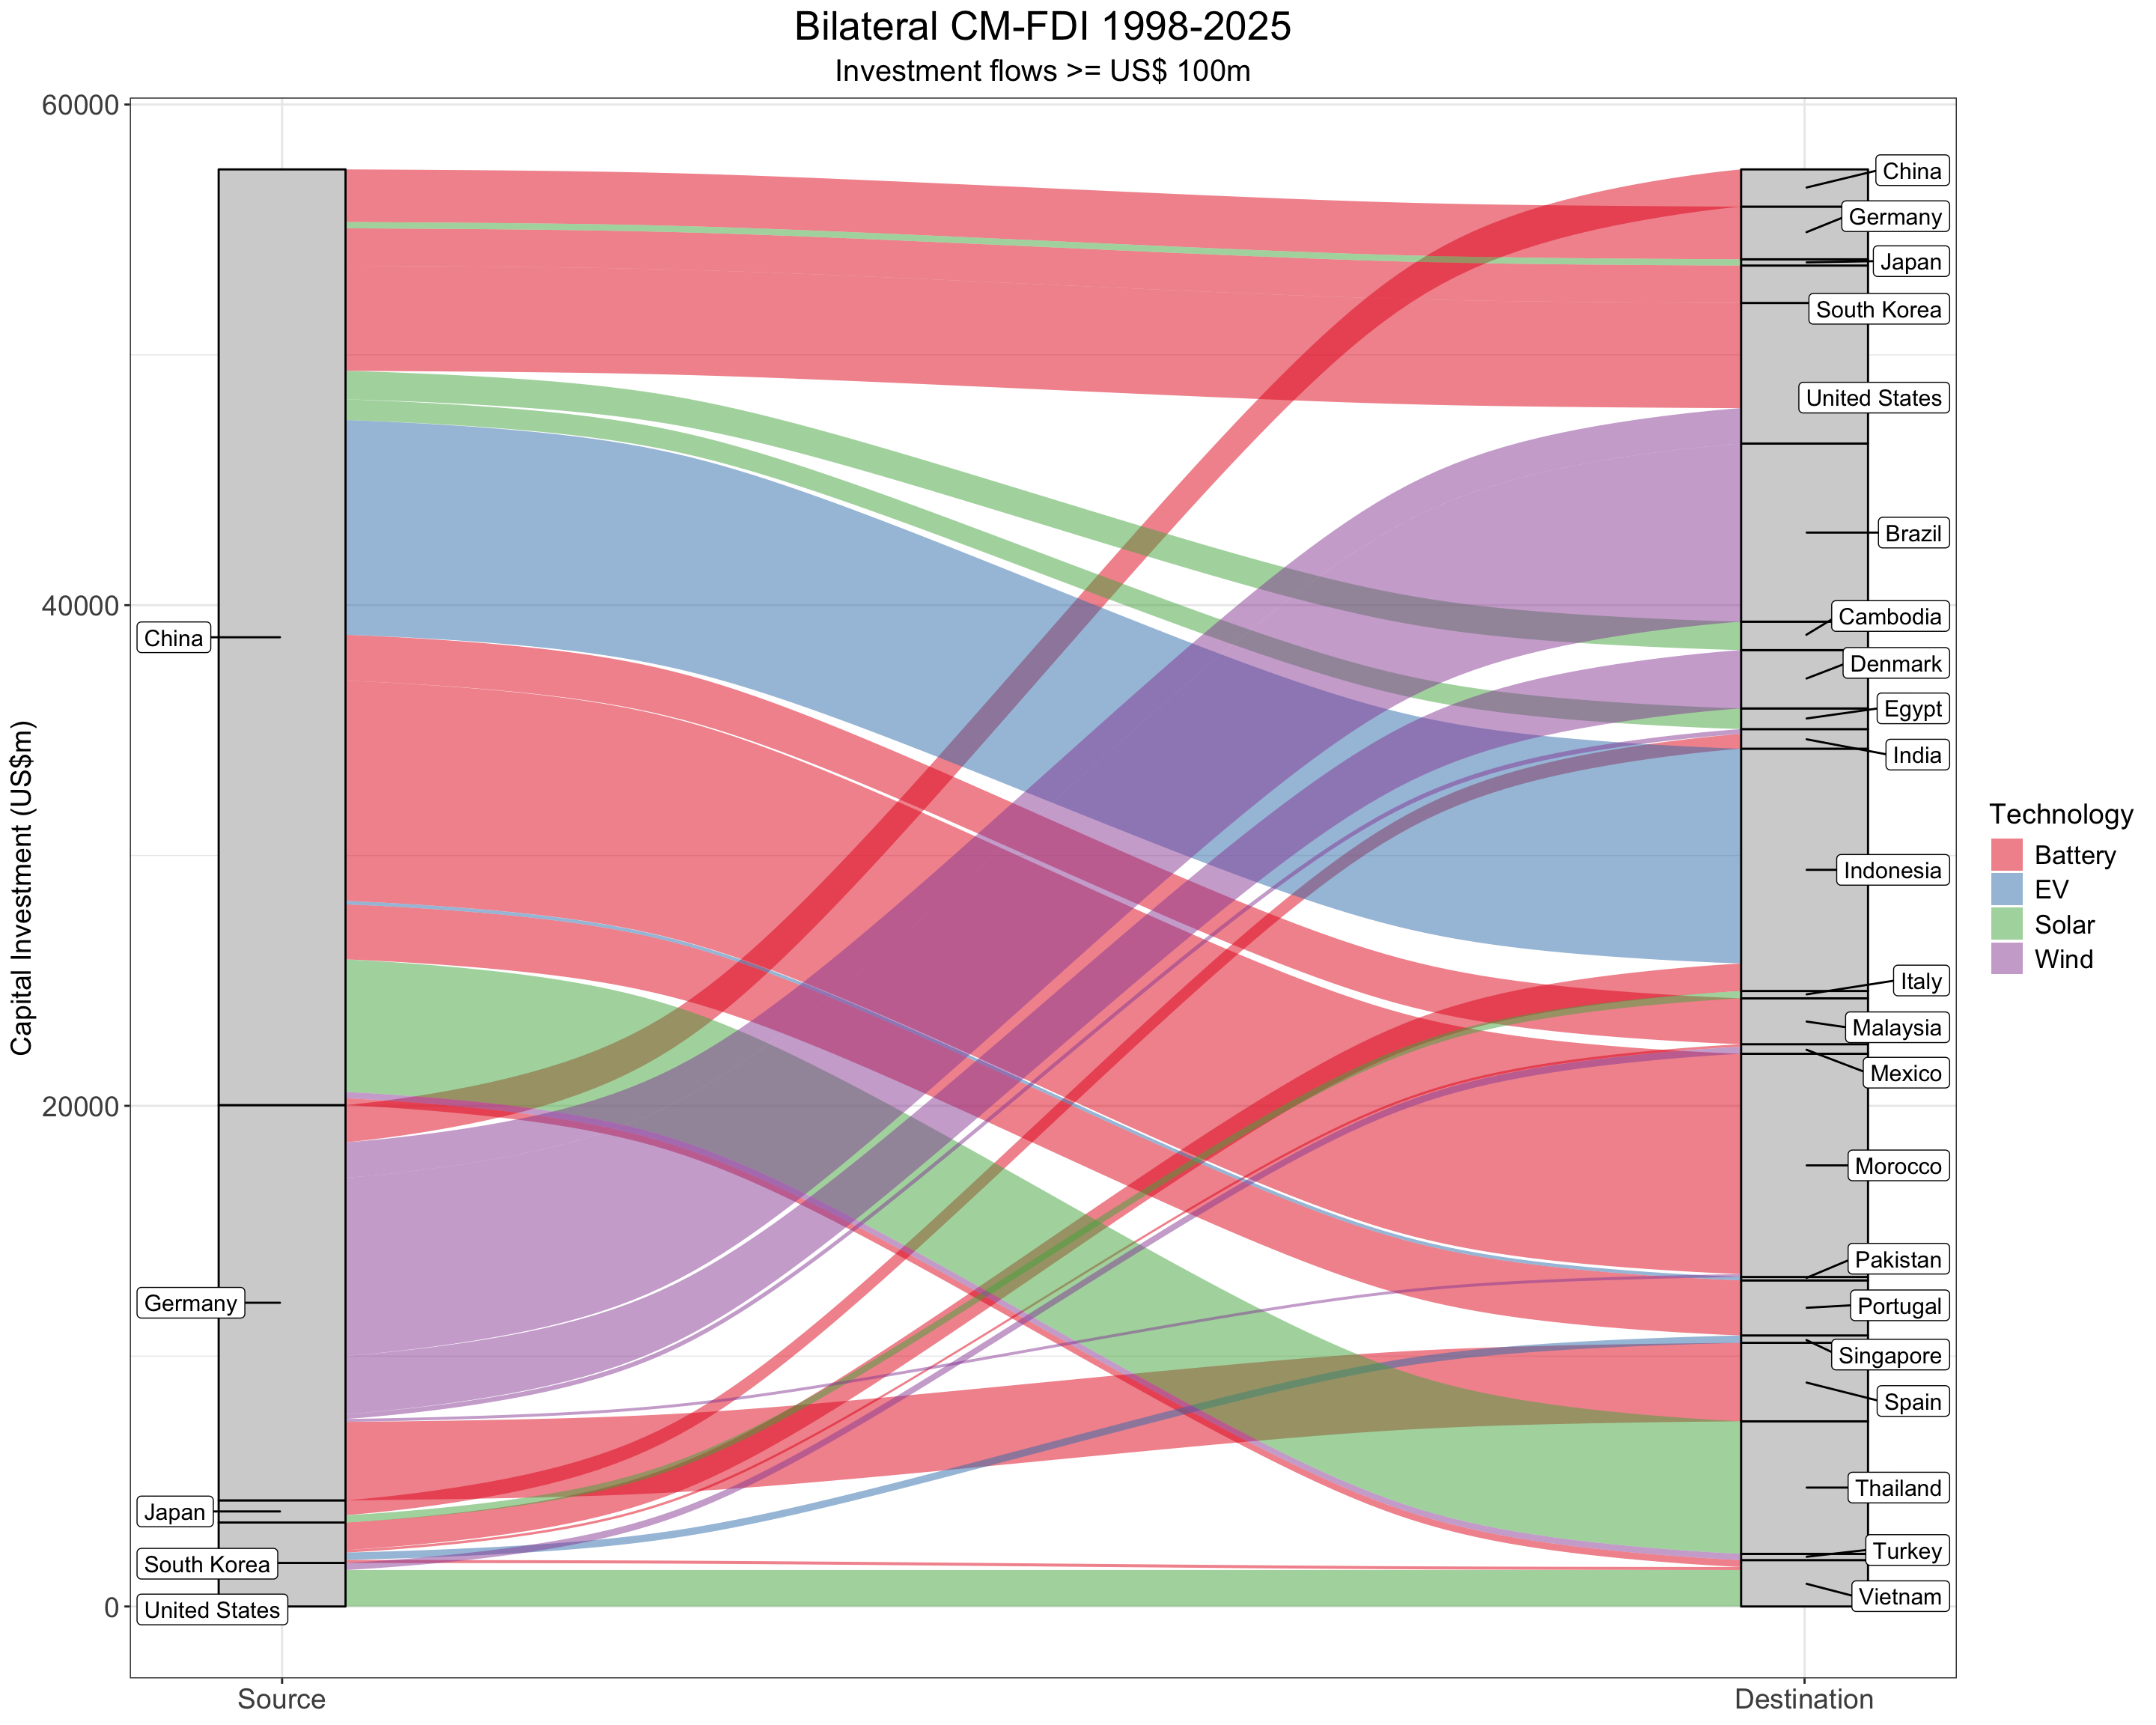
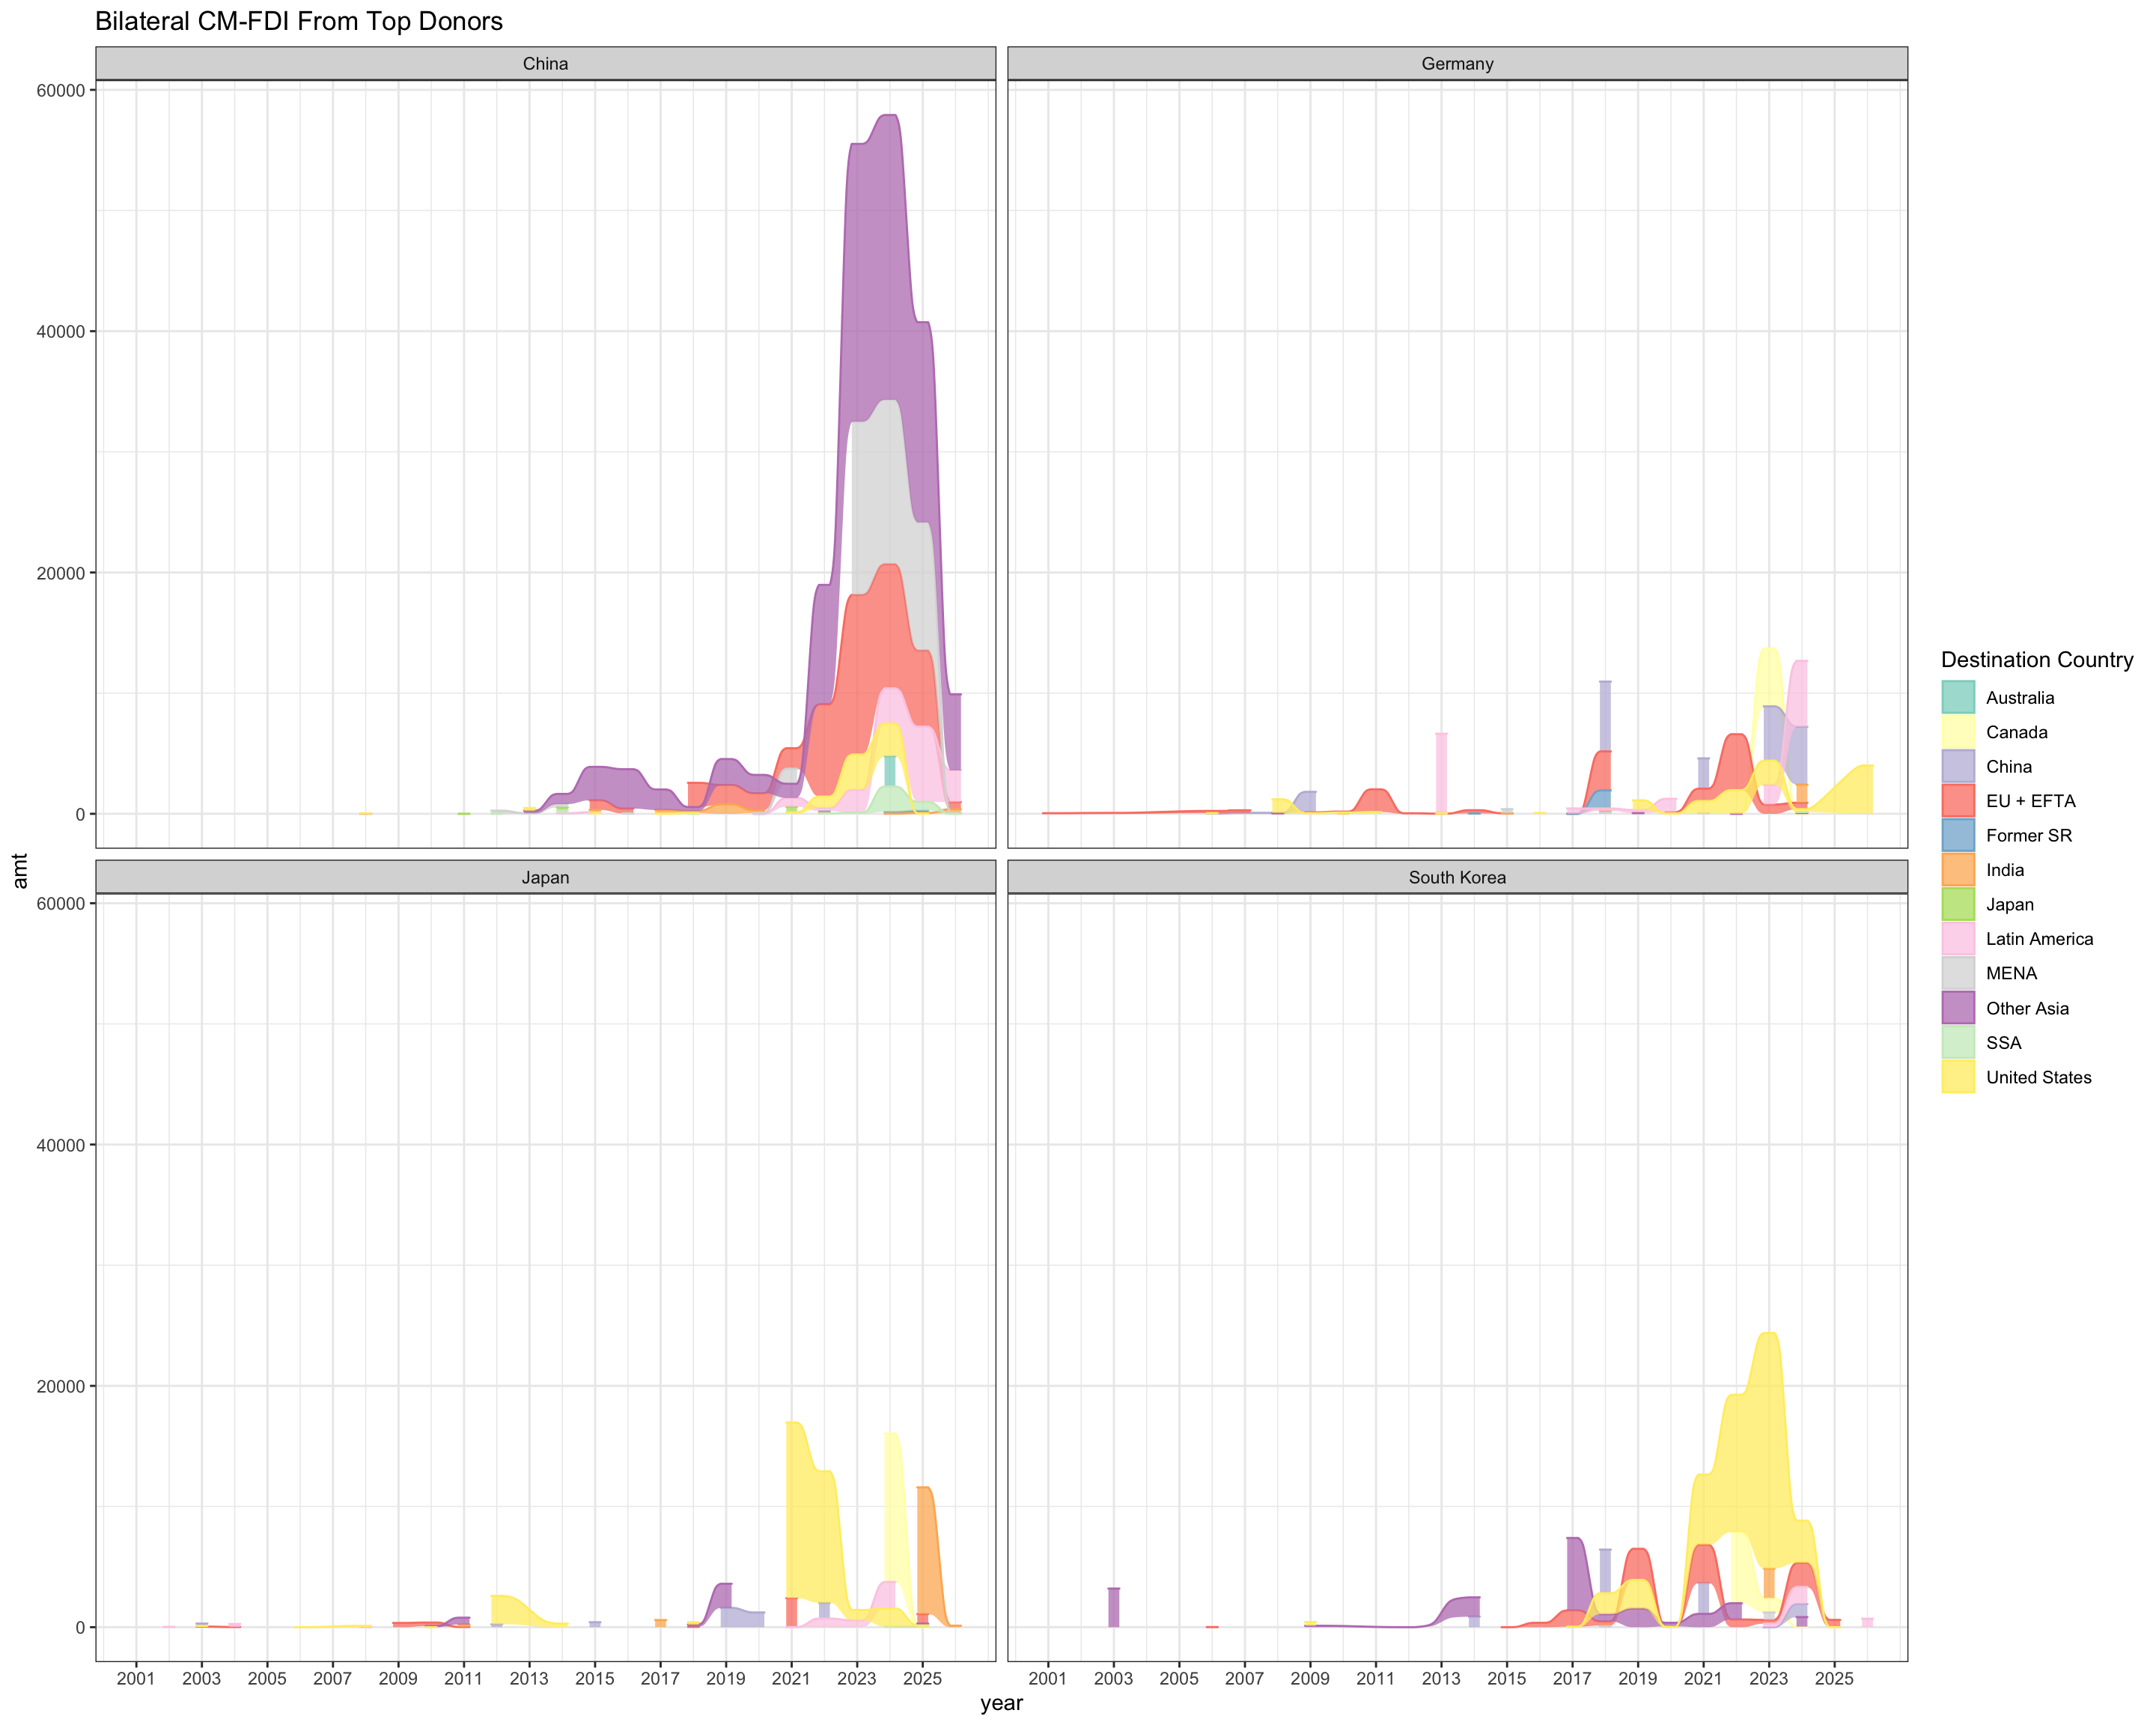
China is by far the largest investor, with 135 billion USD in realized investments.1
Footnotes
That is, excluding projects that are announced but not yet begun or those that were cancelled before completion.↩︎